Uptime Robot Plugin for WordPress Plugin
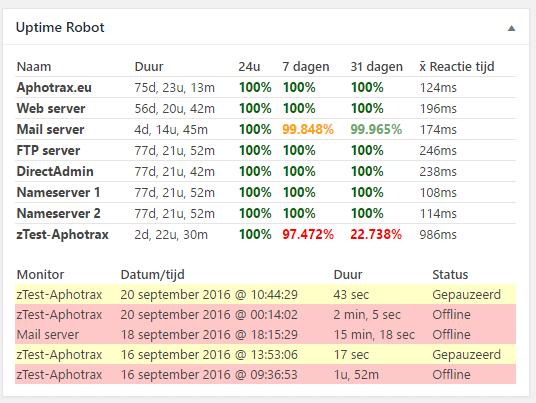
View your uptime stats/logs within WordPress (dashboard), and if desired on pages, posts or in a widget.
This Uptime Robot Plugin for WordPress let’s you show your uptime server stats from Uptime Robot inside the WordPress admin area and if desired on pages, posts or in a widget. You can show multiple monitors on your preffered place using a simpel shortcode.
- Account at UptimeRobot.com required
Simple installation and configuration
Admin side
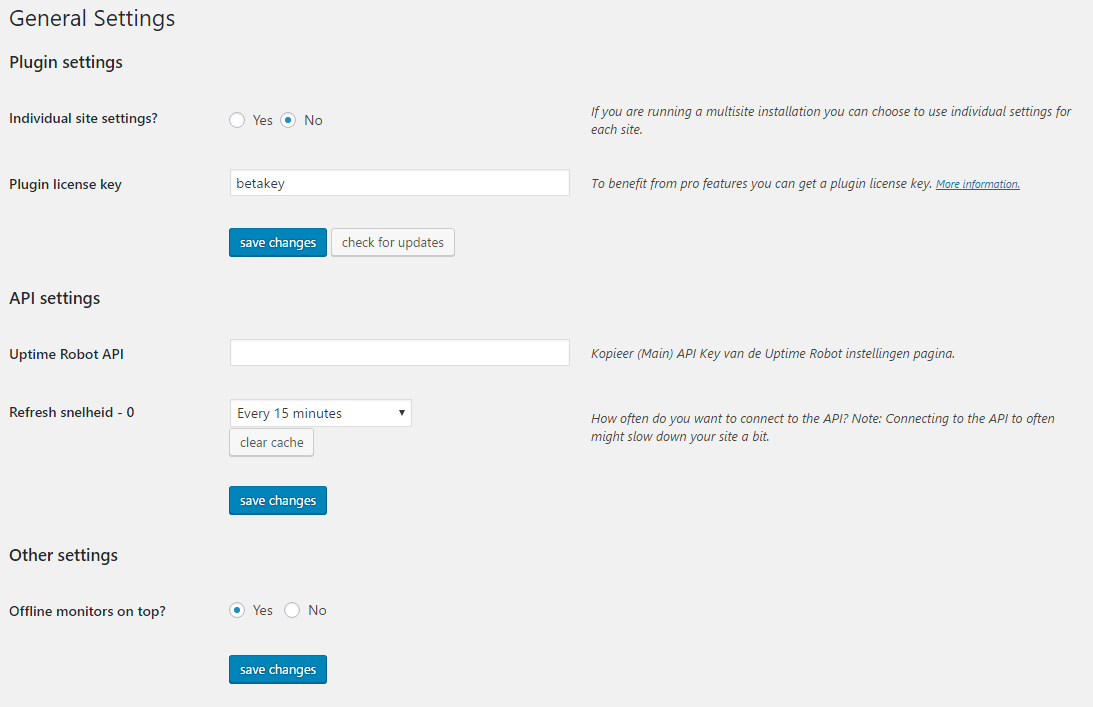
- Settings, choose wich monitors to be enabled, move offline monitors to the top
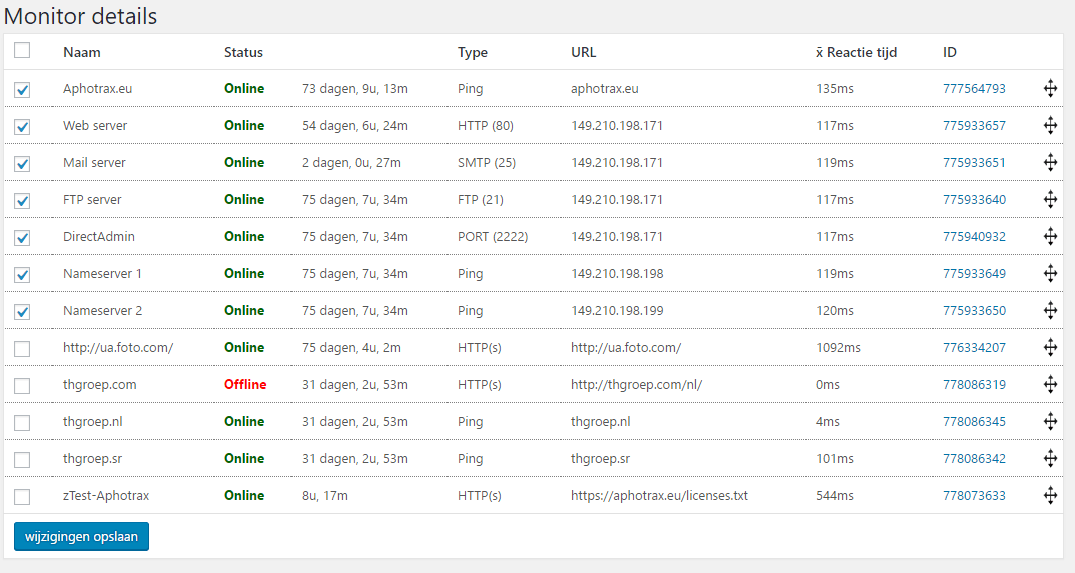
- View all monitors including status, duration and details
- Drag and drop to order monitors
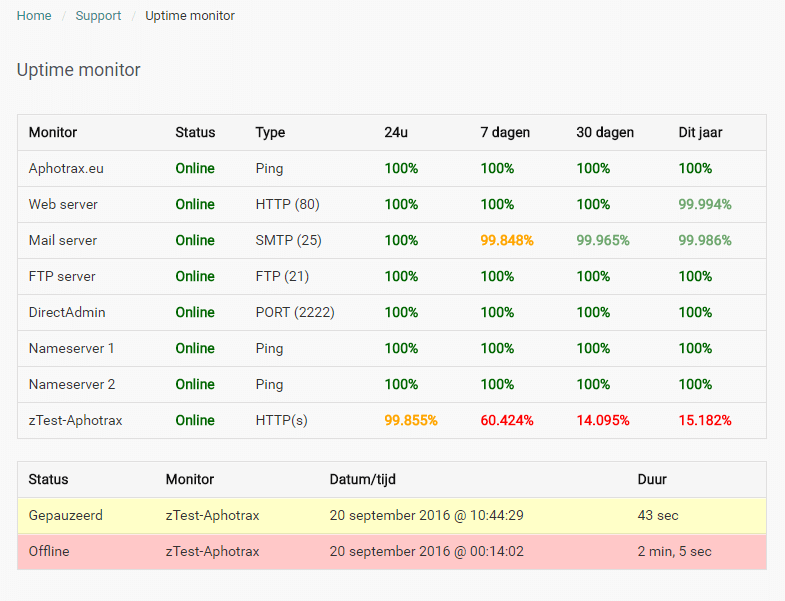
- Logs with offline/paused status history
- Response time charts for all monitors
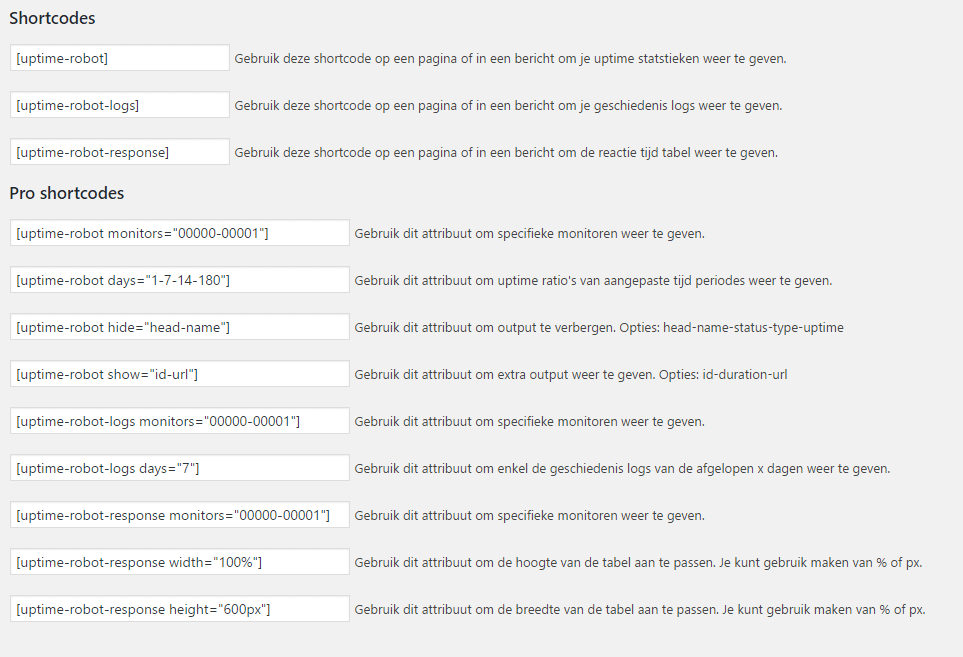
- Shortcode guide
- Custom caching time
Client side
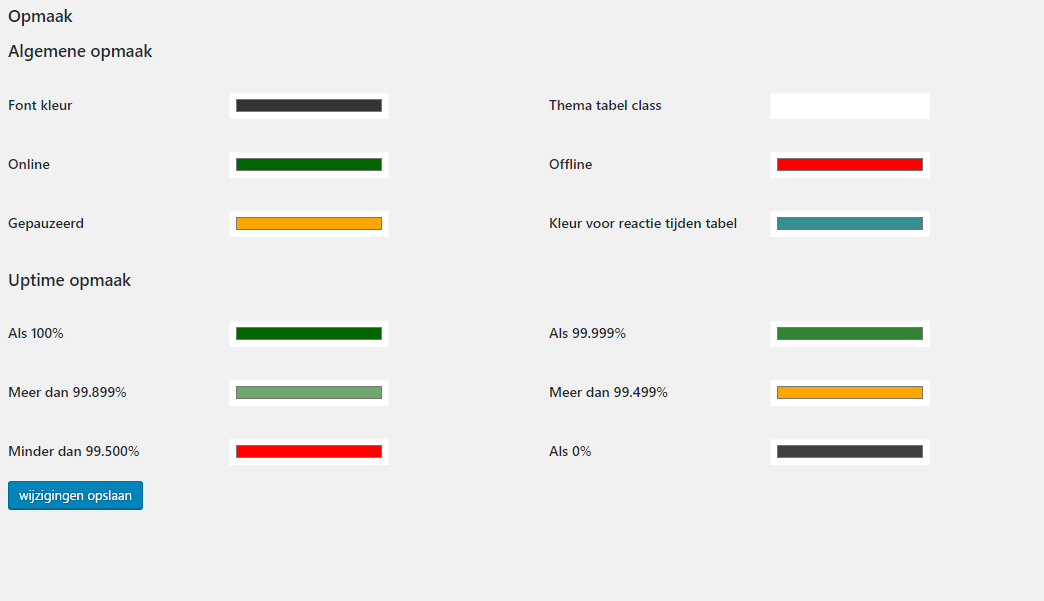
Customize styling
Display uptime stats anywhere with a shortcode [uptime-robot]
Display logs where you want it with a shortcode [uptime-robot-logs]
Display a response time chart where you want it with a shortcode [uptime-robot-response]
- Custom front end shortcodes (see shortcode page inside admin area).
Installation
Upload the files and folder in the zip file ‘uptime-robot-nh’ to the ‘/wp-content/plugins/’ directory.
Activate the plugin through the ‘Plugins’ menu in WordPress
Enter your API Key and monitor id(s) on the settings page
Place a shortcode anywhere you wish.
Screenshots
FAQ
Yes, you can upgrade without a problem to the new version. Just be informed that the shortcodes with -nh in the end are not supported any more. Also some attributes in shortcodes have been changed. I would advise you to check your shortcodes and settings after upgrading. All old settings/options will be deleted from your WordPress installation, only the main apikey will be copied to the new database.
Please upgrade PHP to version 7 or higher to get the ordering correct. Without it you will have to choose if you preffer offline monitors to the top with ordering by id, or manual ordering.
Changelog
2.3
- Fix critical error PHP8: Markxman BV
2.2.2
- Local timezone added to logs: Markxman BV
2.2
- API request method changed so Curl is not needed anymore: cameronjonesweb
- Bugfix MySQL activation: optimalisatie
- Bugfix script registration for jquery: clevercookiedes
- Mysql requests optimized for better performance
2.1.2
- Undefined page error resolved By: mr_swede
2.1.1
- Changes in sortabel function to avoid conflict with other themes. By: Sebastian
- Changes in installation, activation, re-activation. By Jan Jaap
2.1
- Disabled pro
- Duplicate query issue resolved
- Speed improvements
2.0.x
- Changed api uptime_ratios to uptime_ranges for more accurate feedback from API
Added Romainian and complete French language files.
Option added to always show log table even without recent logs
- Changes in upgrade processes
- Small bug fixes
- Partial caching enabled on admin side
- Refresh option for realtime added
- Dashboard widget added back
2.0
- Complete rebuild of the plugin has taken place.
- Multisite support for all round or seperate settings.
- Caching improved and will be done in a seperate DB.
- More then 50 monitors will work.
- Duration of current status enabled.
Can I safely upgrade from V1.x to V2?
Yes, you can upgrade without a problem to the new version. Just be informed that the shortcodes with -nh in the end are not supported any more. Also some attributes in shortcodes have been changed. I would advise you to check your shortcodes and settings after upgrading. All old settings/options will be deleted from your WordPress installation, only the main apikey will be copied to the new database.
